Cambridge mathematics program – Empowering future innovators through early statistical proficiency
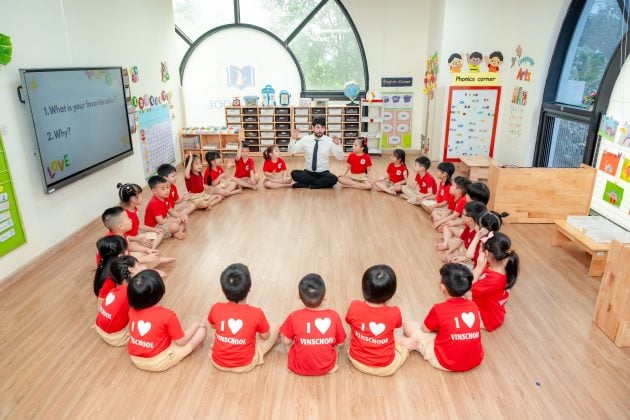
At Vinschool Kindergartens, the Cambridge Mathematics program goes beyond arithmetic, instilling innovative thinking in budding mathematicians through the early introduction of statistical skills.
Vinschool’s unique educational approach, designed with foresight, seamlessly integrates fundamental statistical concepts into the mathematics curriculum, laying a robust foundation from preschool onwards, and preparing students for deeper exploration in primary school.
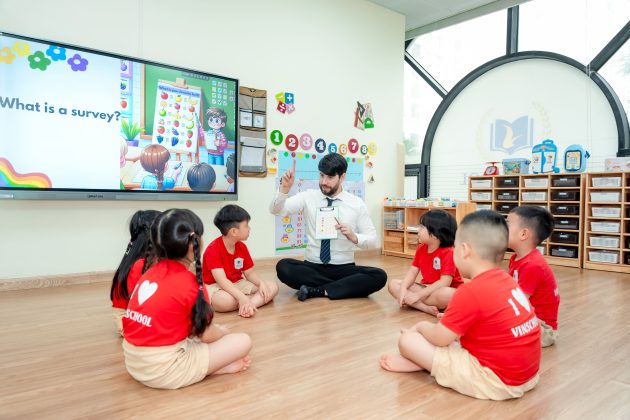
In line with global educational standards, Vinschool begins formal education at age 5, ensuring that its curriculum aligns with international benchmarks to prepare students for future success. The system has carefully meticulously crafted the Math curriculum, making statistics accessible and captivating for young minds. Through interactive activities like surveys and creative data presentations (such as fruit groupings and board demonstrations, etc.), Vinschool kindergarten students not only learn data collection and interpretation but also hone critical skills like inquiry, collaboration, numerical literacy, and analytical thinking – higher-order thinking skills of Bloom’s taxonomy.
These activities are designed to ignite curiosity, encourage inquiry, and cultivate a love for learning beyond the classroom. Join us for an enlightening exploration of statistics at Vinschool Kindergartens!


Afterwards, students present their group’s chart. The entire class then engages in discussions about the insights provided by the chart: Which color is favored the most?; Which color is the least preferred?
- Counting and Comparing: Analyzing the results and comparing the popularity of different colors helps bolster basic math skills and the ability to compare quantities.
- Sharing their findings and explaining their group’s chart to classmates or teachers aids in improving communication skills, both verbally and in writing. This encourages children to articulate their thoughts and discoveries clearly and effectively.
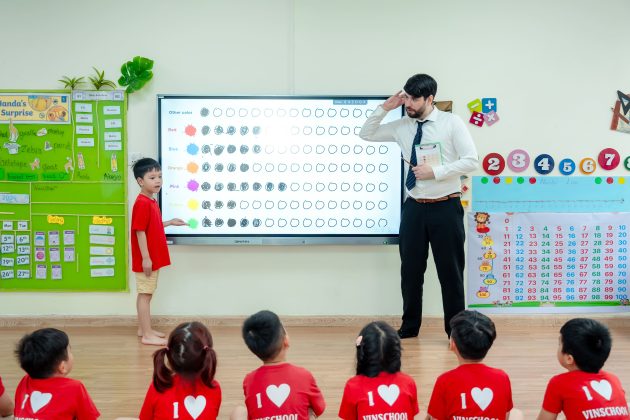
This activity not only equips students with skills in data organization and representation but also fosters an appreciation for the significance of and message conveyed by the data. It fosters a deeper understanding of group preferences, facilitating informed decision-making or observations on specific issues.